Use the Charts dashboard
Get a deeper view into Apple
Search Ads Advanced campaign performance
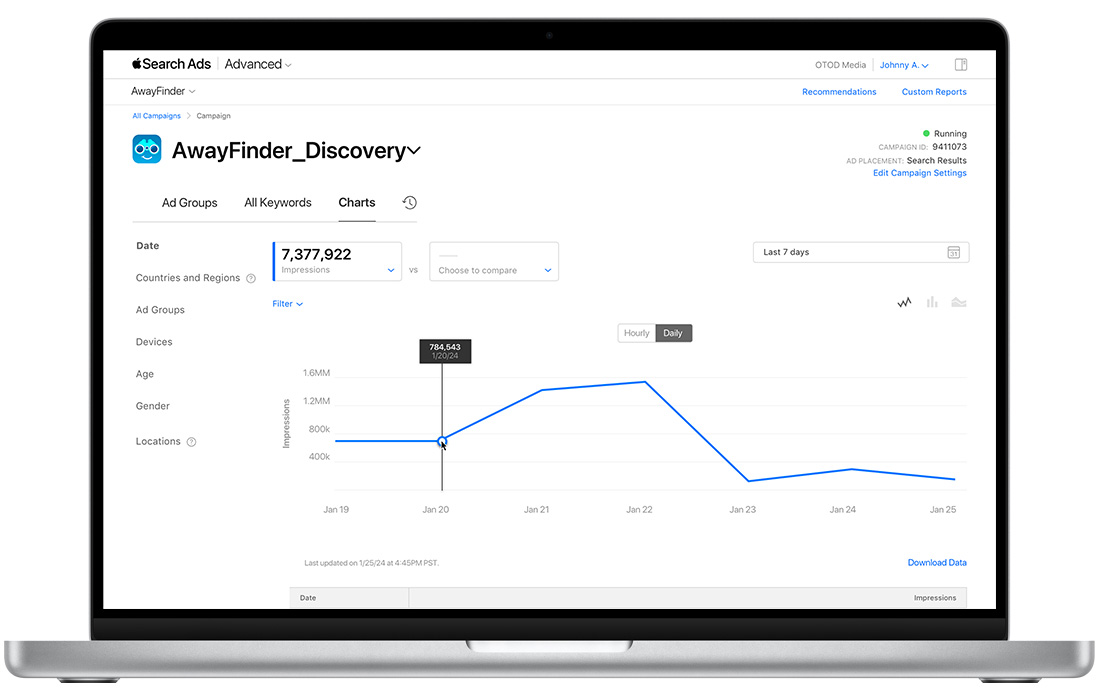
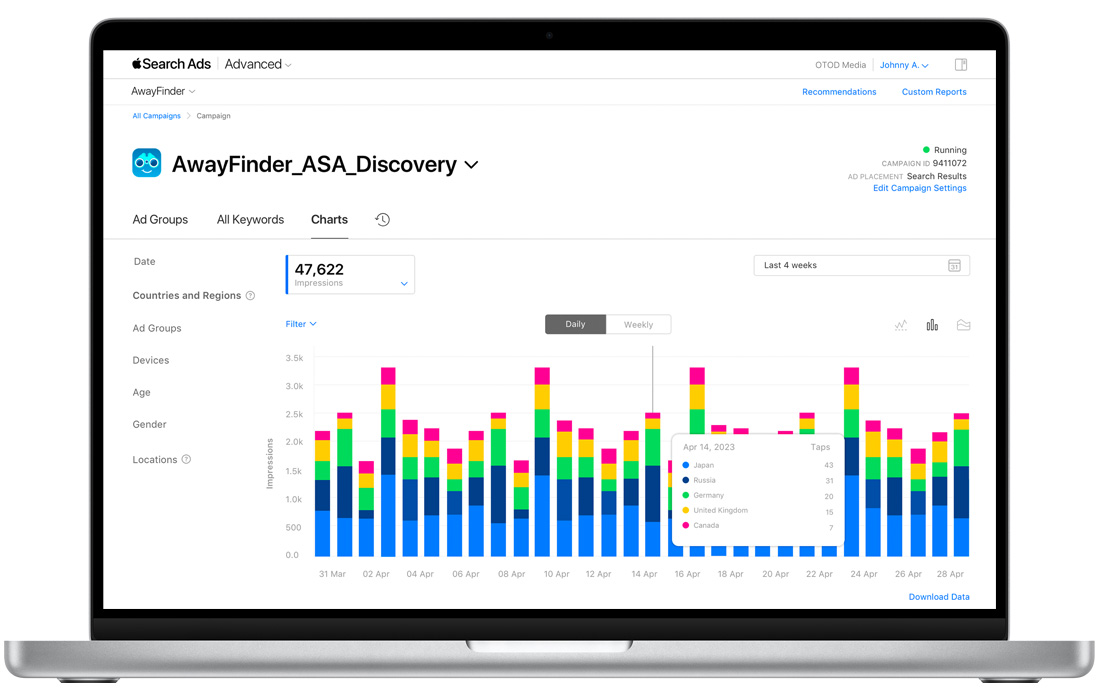
The Apple Search Ads Advanced Charts dashboard lets you view performance by date, countries and regions, ad groups, keywords, devices, or audience refinements, and plot metrics including:
- Spend
- Average CPM (cost-per-thousand-impressions)
- Average CPT (cost-per-tap)
- Average CPA (cost-per-acquisition)
- Impressions
- Taps
- Installs
- TTR (tap-through rate)
- CR (conversion rate)
Like with Campaigns dashboard reporting, the default time period is set for the past seven days, excluding the current day.
The chart you see on the page will automatically change according to the parameters you select. Use the menu above it to select your metric options, and choose which type of report from the navigation on the left.
How to find the Charts dashboard
- Sign in to your Apple Search Ads Advanced account.
- From the Campaigns dashboard, click the campaign you want to view.
- From the Ad Groups dashboard, click the Charts dashboard.
- Choose how you want to view and filter your report.
Note that if you’re selecting more than 30 days of data, your report can be viewed only on a weekly basis.
How to read charts
1) Chart view
The chart view at the top of the Charts dashboard gives you a snapshot of your performance metrics by date. You can filter your view and compare metrics for a deeper dive into your campaign data. Note that the date view is the only one that allows you to select multiple metrics.
Filter options will appear in the top left corner of the charts and once applied, will persist until you remove or change them. When you adjust the filters, you’ll see a new visual immediately.

2) Table view
A table combines the totals for each group within your chosen view, according to the filter and metric you’ve selected. Your available filters depend on your view.
Note that metrics are reported in your account’s time zone. To review metrics in the same time zone as your billing transaction history, select UTC in the time zone menu in the footer. Your chosen date range may change slightly to reflect UTC time differences. The search terms, age, gender, and location reports are not viewable in UTC.
How to change the date range of your
performance view
Go to the menu on the right side of the page. There, you can chose from date ranges including Today, Yesterday, Last 7 Days, This Week, Last Week, Last 30 Days, Last 4 Weeks, Last 12 Weeks, This Month, Last Month, and a Custom Range.
Additional Charts dashboard variables
Gender, Age, and Location “User Withheld”
If you didn’t apply audience refinements within your ad group or campaign, a category titled “User Withheld” may appear beneath the age, gender, or location sections in your reporting view. This reflects that some users who saw your ad had chosen not to allow Apple Search Ads to use their information for ad targeting, or may have had location services turned off on their device.

Age-range reporting
When viewing your reports by age, metrics are grouped into the following preset age groups: 18-24, 25-34, 35-44, 45-54, 55-64,65+. This means that you may see impression results that appear to be for a wider age range than you selected. However, we target only the ages you specify within each group. For instance, if you select 18 to 38, your reporting shows impressions in the ranges 18-24, 25-34 and 35‑44.
“Low Volume” indicator
Some charts may return a value of “Low Volume.” This means the data you’re requesting is below Apple’s privacy threshold. For example, search terms must reach at least 10 impressions per day, otherwise the “low volume” value will appear in your search term chart. Age, gender, or location reports require at least 100 impressions per day before Apple Search Ads can show any values.